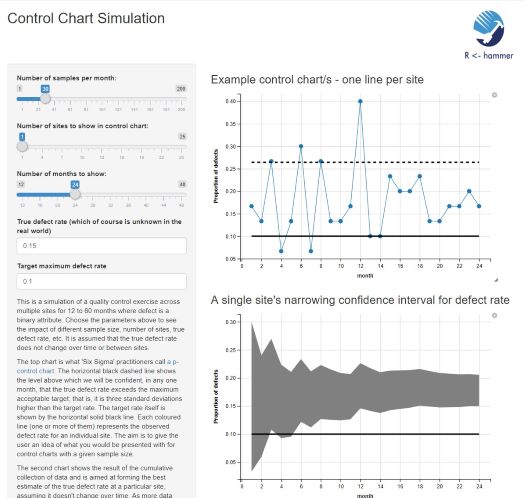
Statistical Control Chart Simulation
Control charts, also known process-behavior charts, are a statistical process control tool used to determine if a manufacturing or business process is in a state of control. Traditional control charts are mostly designed to monitor process parameters when underlying form of the process distributions are known. However, more advanced techniques are available where incoming data streaming can-be monitored even without any knowledge of the underlying process distributions. Distribution-free control charts are becoming increasingly popular.
Challenge
Develop a control chart simulator to remind me of my aerospace defense manufacturing days.
Solution
This R Shiny application was written for fun but the principles are statistically valid today!.
View Demo Dashboard (Temporarily disabled AWS environment for cost savings!)
Project Platform
✅ Shiny Web Applications
✅ HTML and CSS
✅ Statistics
✅ Hosted on a Docker container on AWS