US Border Crossing Analysis
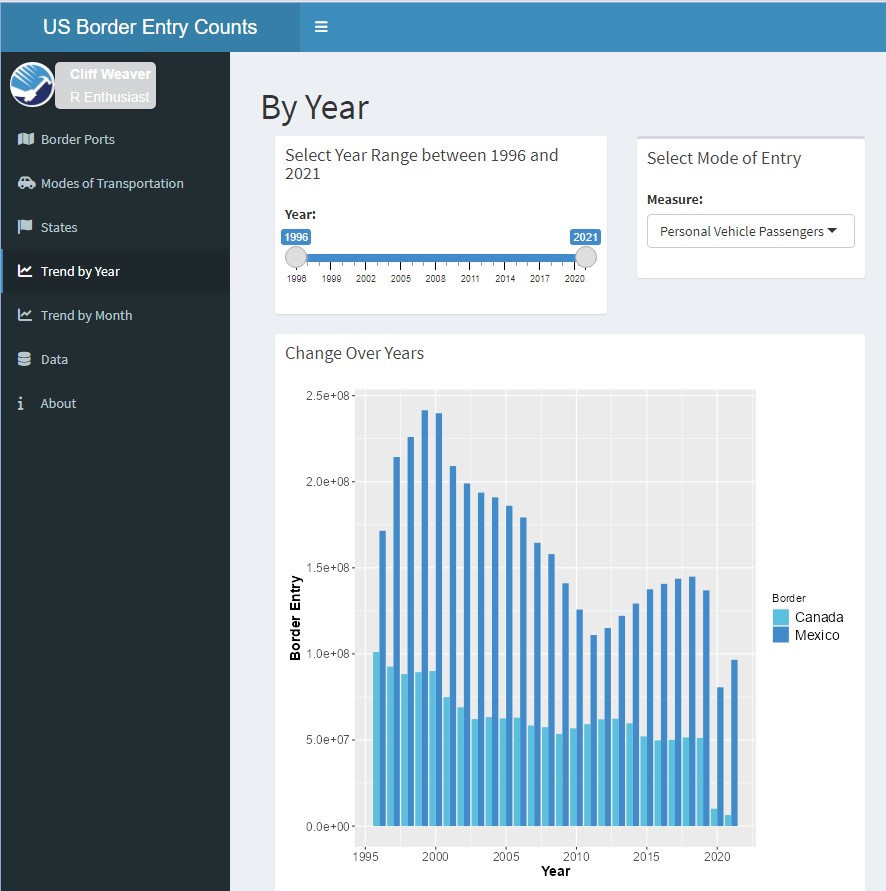
This app is based on the Bureau of Transportation Statistics (BTS) Border Crossing Data. Data are collected at U.S.-Canada and U.S.-Mexico border at the port level for the inbound crossings by U.S. Customs and Border Protection (CBP). Data include the number of vehicles, containers, passengers and pedestrians along with type of transportation such as trucks, trains, buses and personal vehicles.
Challenge
US Immigration has been in the news lately so a data-driven analysis of US Border Crossing seemed like a fun way to better understand the issues.
Solution
Used the Flexdashboard platform to build an informative analysis of US Border Crossings.
View Demo Dashboard (Temporarily disabled AWS environment for cost savings!)
Project Platform
✅ Shiny Dashboard
✅ HTML & CSS
✅ Hosted on a Docker container on AWS